barChart
Create bar charts to compare categorical data with horizontal or vertical bars.
Usage
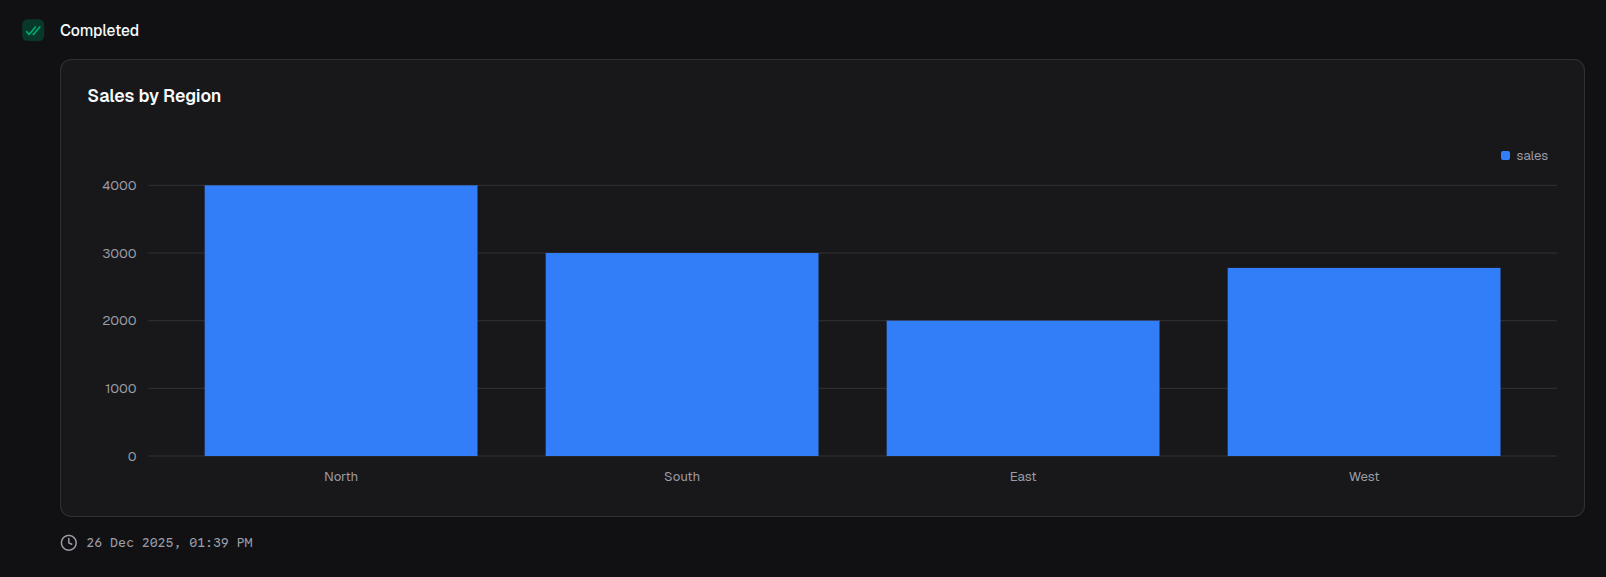
const chart = block.barChart({
  title: 'Sales by Region',
  data: [
    { region: 'North', sales: 4000 },
    { region: 'South', sales: 3000 },
    { region: 'East', sales: 2000 },
    { region: 'West', sales: 2780 },
  ],
  index: 'region',
  categories: ['sales'],
})
Props
| Prop | Description | Type | Required | Default |
|---|---|---|---|---|
| title | Chart title displayed above the chart | string | No | undefined |
| description | Description text below the title | string | No | undefined |
| data | Array of data objects to visualize | T[] | Yes | — |
| index | Key of the data object for the x-axis | keyof T | Yes | — |
| categories | Keys of the data object for the bar values | (keyof T)[] | Yes | — |
| colors | Colors for each category series | ChartColor[] | No | ['blue'] |
| xAxisLabel | Label for the x-axis | string | No | undefined |
| yAxisLabel | Label for the y-axis | string | No | undefined |
| layout | Bar orientation | 'horizontal' | 'vertical' | No | 'horizontal' |
| stackType | How bars are stacked | 'default' | 'stacked' | 'percent' | No | 'default' |
| intervalType | X-axis tick placement logic | 'equidistantPreserveStart' | 'preserveStartEnd' | No | 'equidistantPreserveStart' |
| startEndOnly | Show only start and end labels on x-axis | boolean | No | false |
| showXAxis | Whether to display the x-axis | boolean | No | true |
| showYAxis | Whether to display the y-axis | boolean | No | true |
| showGridLines | Whether to display grid lines | boolean | No | true |
| showTooltip | Whether to display tooltips on hover | boolean | No | true |
| showLegend | Whether to display the legend | boolean | No | true |
| valueFormat | Format configuration for values | ValueFormat | No | undefined |
Returns
Returns a BarChartOutput object that can be returned from a handler or passed to io.message().
Examples
Grouped bar chart
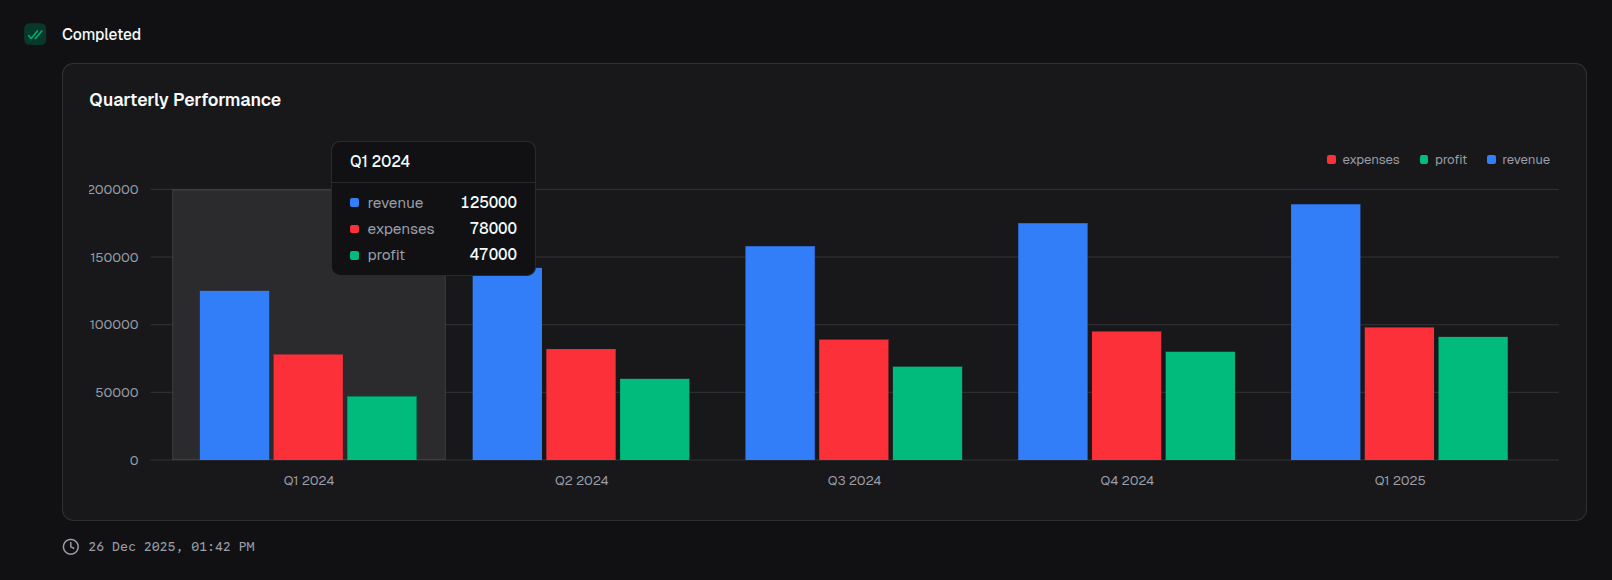
return block.barChart({
  title: 'Quarterly Performance',
  data: quarterlyData,
  index: 'quarter',
  categories: ['revenue', 'expenses', 'profit'],
  colors: ['blue', 'red', 'emerald'],
})
Horizontal bar chart
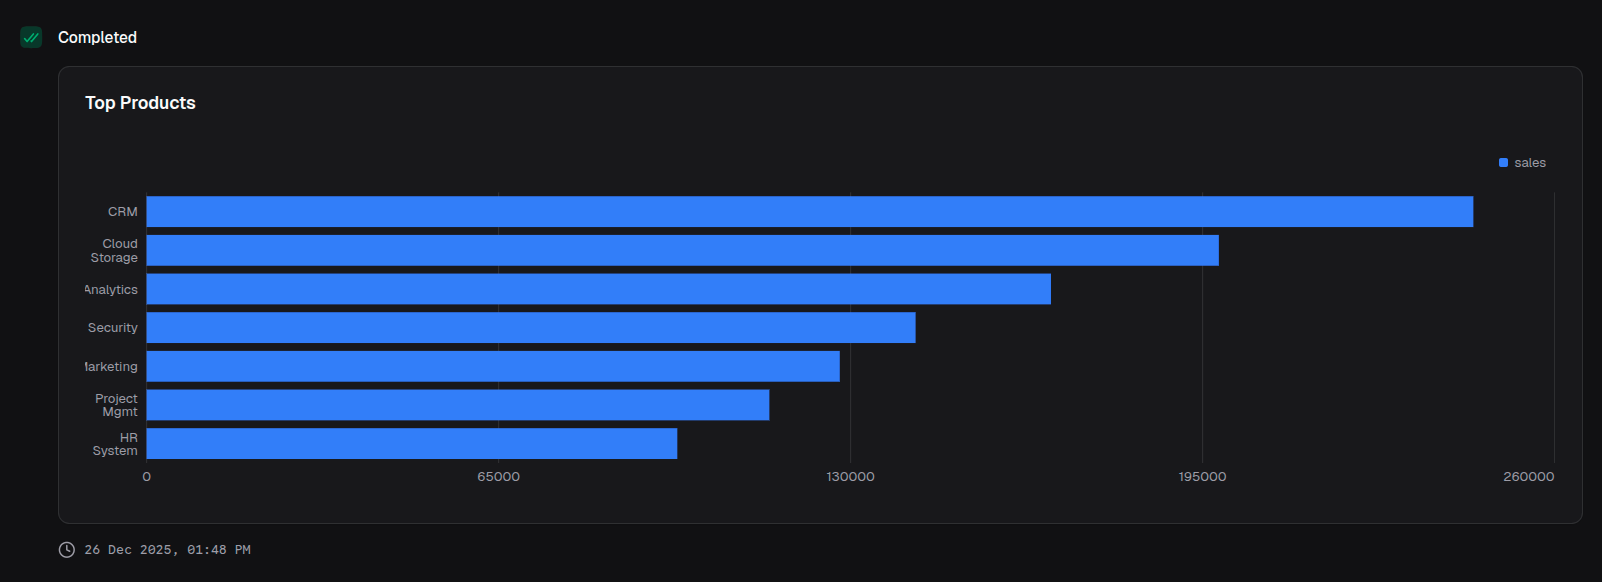
return block.barChart({
  title: 'Top Products',
  data: productData,
  index: 'product',
  categories: ['sales'],
  layout: 'vertical', // Flips to horizontal bars
})
Stacked bar chart
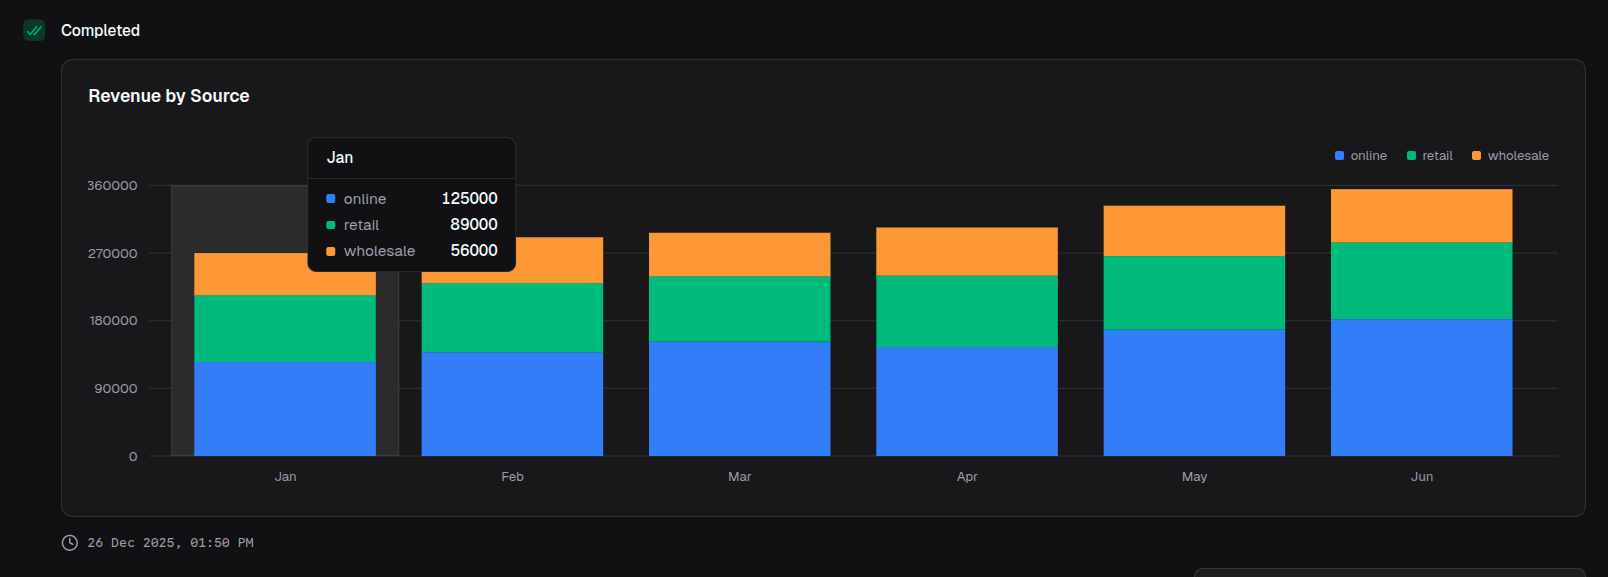
return block.barChart({
  title: 'Revenue by Source',
  data: revenueData,
  index: 'month',
  categories: ['online', 'retail', 'wholesale'],
  colors: ['blue', 'emerald', 'amber'],
  stackType: 'stacked',
})
Percentage stacked chart
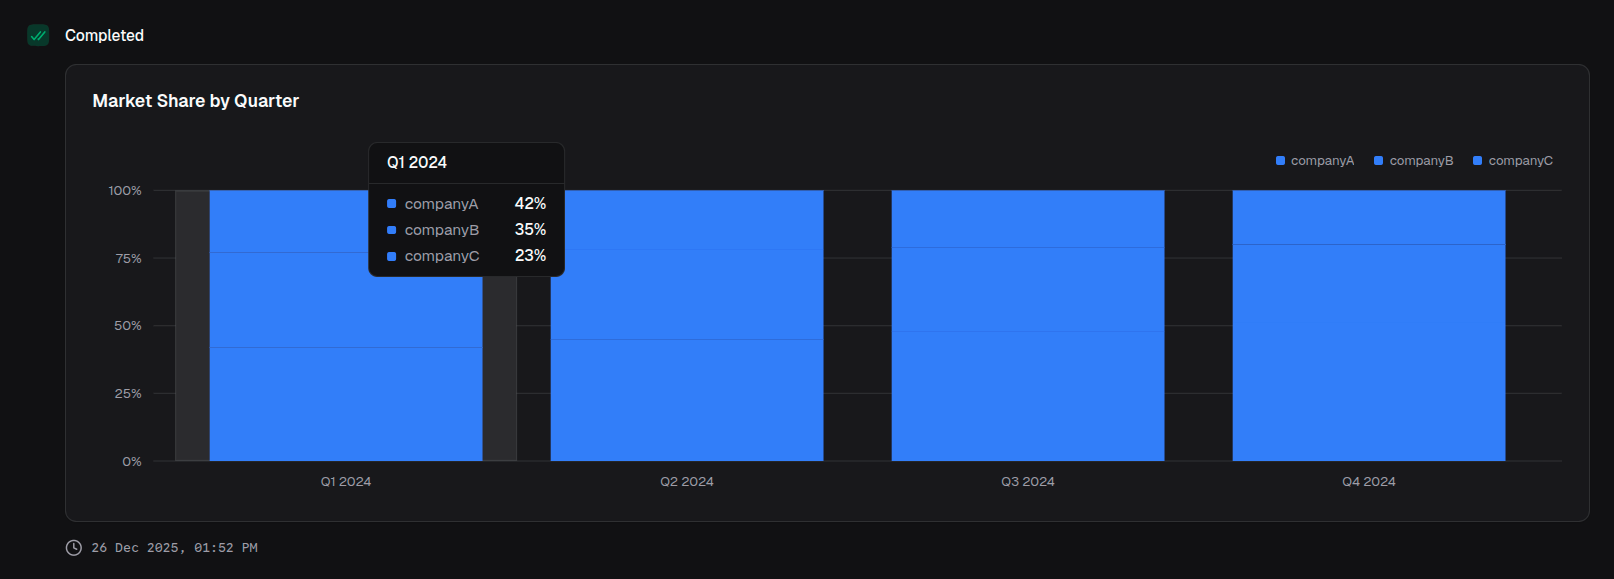
return block.barChart({
  title: 'Market Share by Quarter',
  data: marketData,
  index: 'quarter',
  categories: ['companyA', 'companyB', 'companyC'],
  stackType: 'percent',
  valueFormat: { type: 'percentage' },
})
With currency formatting
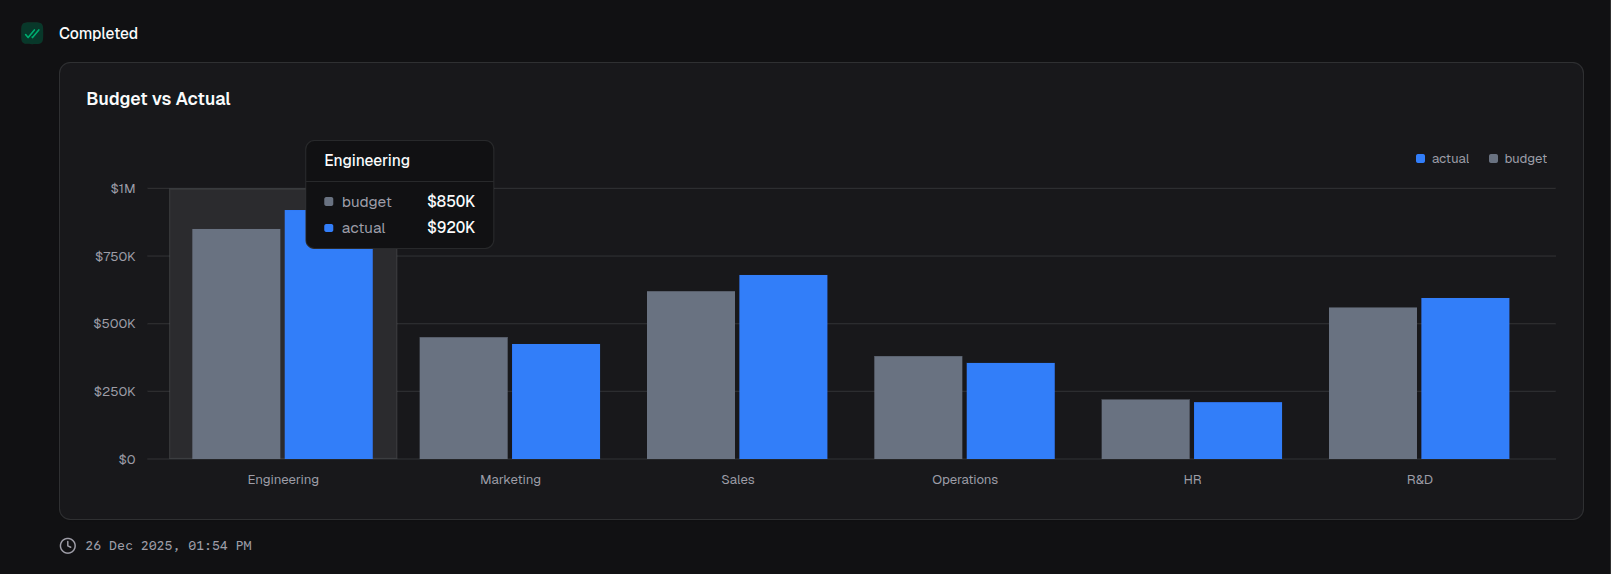
return block.barChart({
  title: 'Budget vs Actual',
  data: budgetData,
  index: 'department',
  categories: ['budget', 'actual'],
  colors: ['gray', 'blue'],
  valueFormat: {
    type: 'currency',
    currency: 'USD',
    notation: 'compact',
  },
})