sparkChart
Create compact inline charts for quick trend visualization.
Usage
const chart = block.sparkChart({
  data: [
    { time: '1', value: 10 },
    { time: '2', value: 25 },
    { time: '3', value: 18 },
    { time: '4', value: 32 },
  ],
  index: 'time',
  categories: ['value'],
})
Props
| Prop | Description | Type | Required | Default |
|---|---|---|---|---|
| title | Chart title (rarely used for spark charts) | string | No | undefined |
| description | Description text | string | No | undefined |
| data | Array of data objects to visualize | T[] | Yes | — |
| index | Key of the data object for the x-axis | keyof T | Yes | — |
| categories | Keys of the data object for the series | (keyof T)[] | Yes | — |
| colors | Colors for each category | ChartColor[] | No | ['blue'] |
| sparkChartType | Type of spark chart | 'area' | 'line' | 'bar' | No | 'area' |
| fillType | Fill type for area charts | 'gradient' | 'solid' | 'none' | No | 'gradient' |
| stackType | How series are stacked | 'default' | 'stacked' | 'percent' | No | 'default' |
Returns
Returns a SparkChartOutput object that can be returned from a handler or used within KPI cards.
Examples
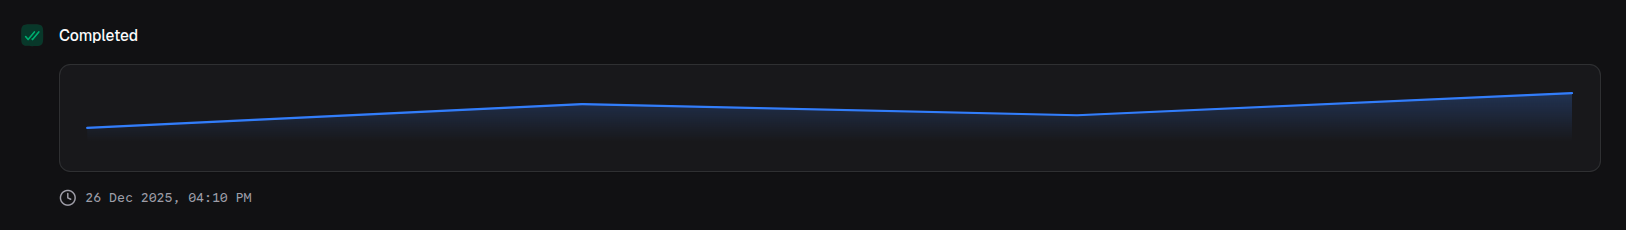
Area spark chart
return block.sparkChart({
data: trendData,
index: 'time',
categories: ['value'],
sparkChartType: 'area',
colors: ['emerald'],
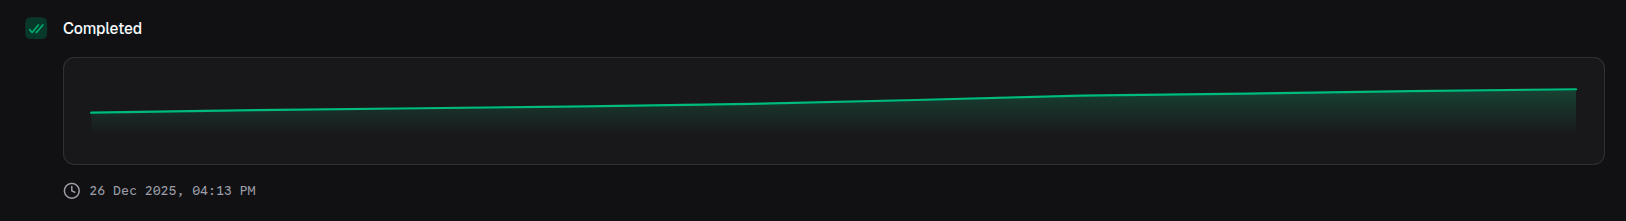
})Line spark chart
return block.sparkChart({
  data: priceData,
  index: 'date',
  categories: ['price'],
  sparkChartType: 'line',
  colors: ['blue'],
})
Bar spark chart
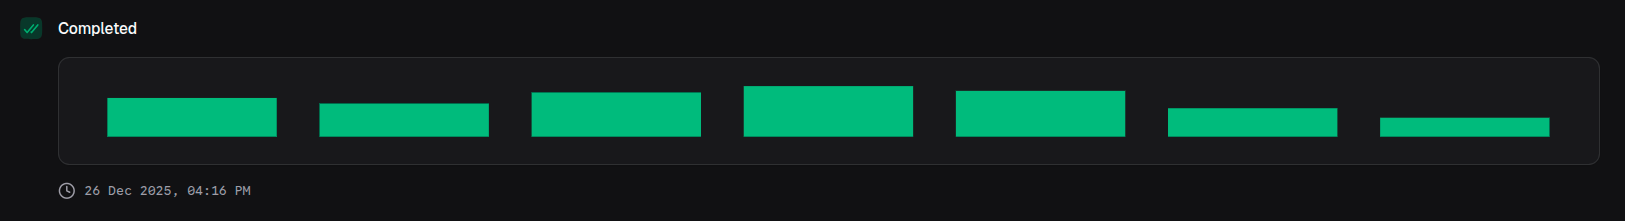
return block.sparkChart({
  data: volumeData,
  index: 'day',
  categories: ['volume'],
  sparkChartType: 'bar',
  colors: ['violet'],
})
Inside a KPI card
Spark charts are commonly used within KPI cards:
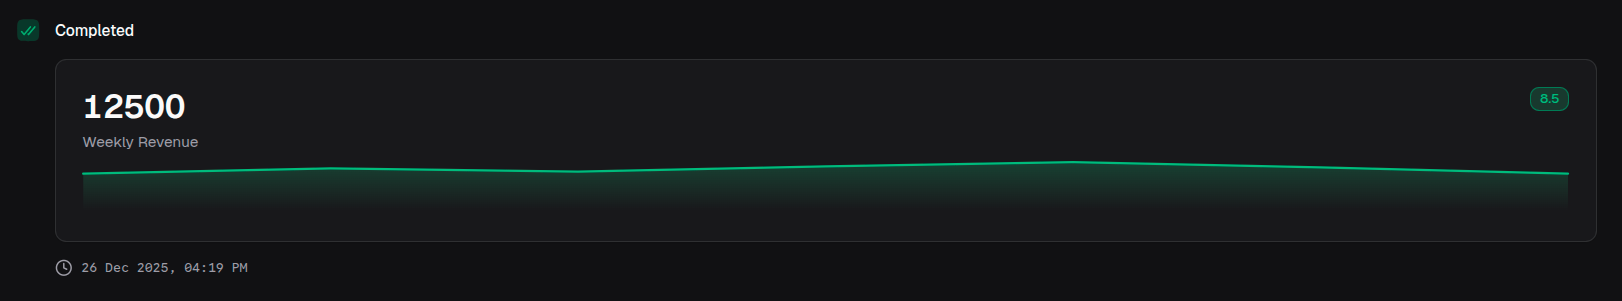
return block.kpiCard({
  name: 'Weekly Revenue',
  value: 12500,
  valueFormat: { type: 'currency', currency: 'USD' },
  change: 8.5,
  changeType: 'positive',
  chart: {
    type: 'chart',
    chartType: 'spark-chart',
    data: weeklyData,
    index: 'day',
    categories: ['revenue'],
    sparkChartType: 'area',
    colors: ['emerald'],
  },
})
Multi-series spark chart
return block.sparkChart({
  data: comparisonData,
  index: 'time',
  categories: ['actual', 'target'],
  colors: ['blue', 'gray'],
  sparkChartType: 'line',
})