kpiCard
Display key performance indicators with optional change indicators and embedded charts.
Usage

const card = block.kpiCard({
  name: 'Total Revenue',
  value: 125000,
  valueFormat: { type: 'currency', currency: 'USD' },
  change: 12.5,
  changeType: 'positive',
})
Props
| Prop | Description | Type | Required | Default |
|---|---|---|---|---|
| name | Name/identifier for the KPI | string | Yes | — |
| value | Main value to display | number | string | Yes | — |
| valueFormat | Format configuration for the value | ValueFormat | No | undefined |
| change | Change value (e.g., percentage change) | number | string | No | undefined |
| changeType | Type of change for styling | 'positive' | 'negative' | 'neutral' | No | undefined |
| chart | Embedded chart for additional context | KPICardChart | No | undefined |
ValueFormat
| Property | Description | Type | Default |
|---|---|---|---|
| type | Format type | 'number' | 'currency' | 'percentage' | 'number' |
| decimals | Decimal precision (0-10) | number | 0 |
| currency | Currency code | string | 'USD' |
| currencyDisplay | How to display currency | 'symbol' | 'code' | 'name' | 'symbol' |
| notation | Number notation | 'standard' | 'compact' | 'standard' |
| locale | Locale for formatting | string | 'en-US' |
KPICardChart Types
KPI cards can embed these chart types (without title/description):
category-bar- Segmented horizontal barprogress-bar- Progress indicator barprogress-circle- Circular progressspark-chart- Inline trend charttracker- Status tracker
Returns
Returns a KPI card block that can be returned from a handler or passed to io.message().
Examples
Basic KPI card
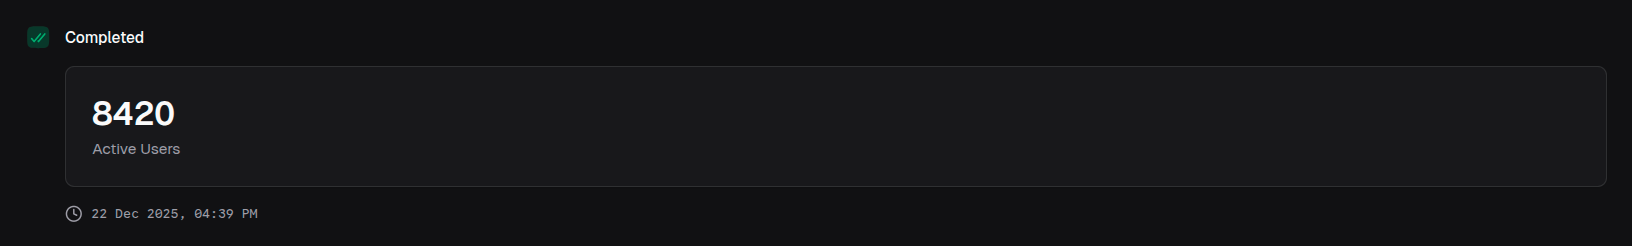
return block.kpiCard({
  name: 'Active Users',
  value: 8420,
})
With change indicator
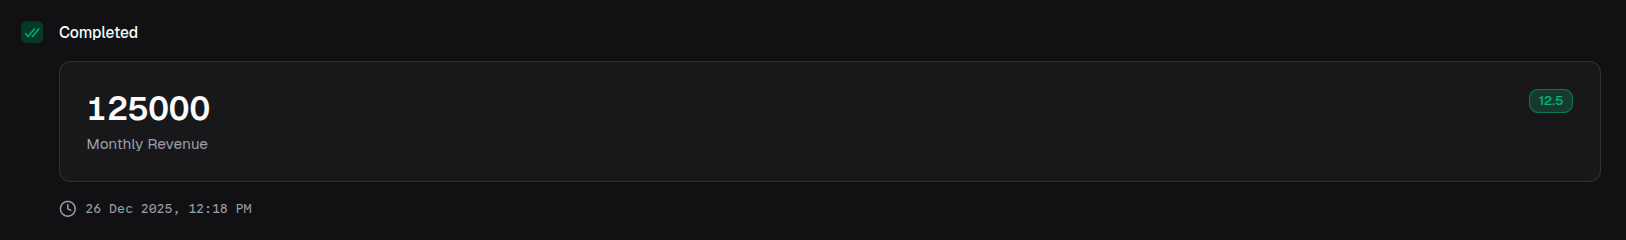
return block.kpiCard({
  name: 'Monthly Revenue',
  value: 125000,
  valueFormat: {
    type: 'currency',
    currency: 'USD',
    notation: 'compact',
  },
  change: 12.5,
  changeType: 'positive',
})
Negative change
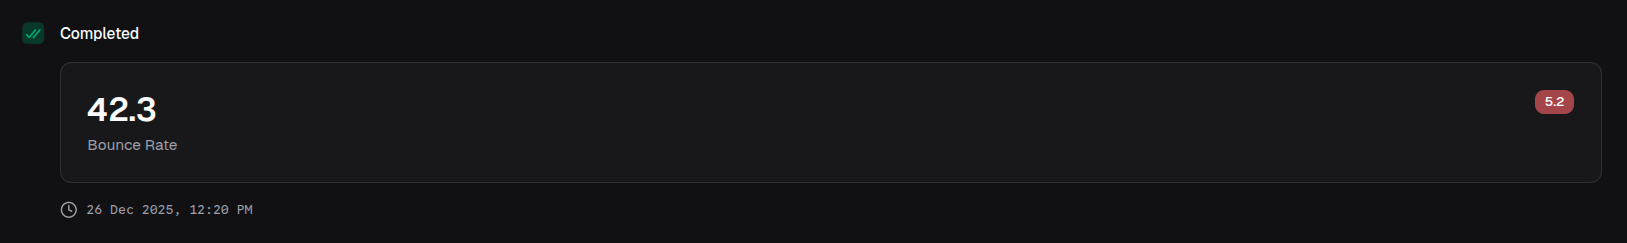
return block.kpiCard({
  name: 'Bounce Rate',
  value: 42.3,
  valueFormat: { type: 'percentage', decimals: 1 },
  change: 5.2,
  changeType: 'negative',
})
With spark chart
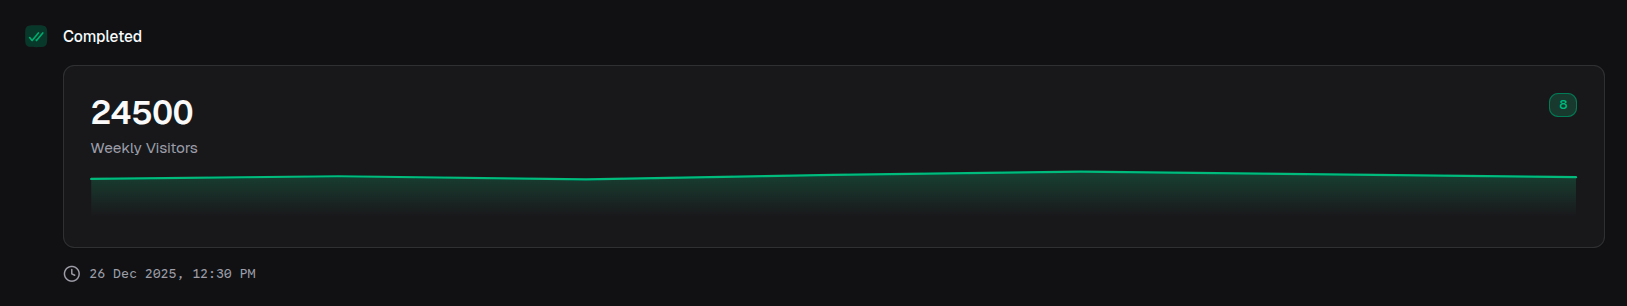
return block.kpiCard({
  name: 'Weekly Visitors',
  value: 24500,
  change: 8,
  changeType: 'positive',
  chart: {
    type: 'chart',
    chartType: 'spark-chart',
    data: weeklyData,
    index: 'day',
    categories: ['visitors'],
    sparkChartType: 'area',
    colors: ['emerald'],
  },
})
With progress bar

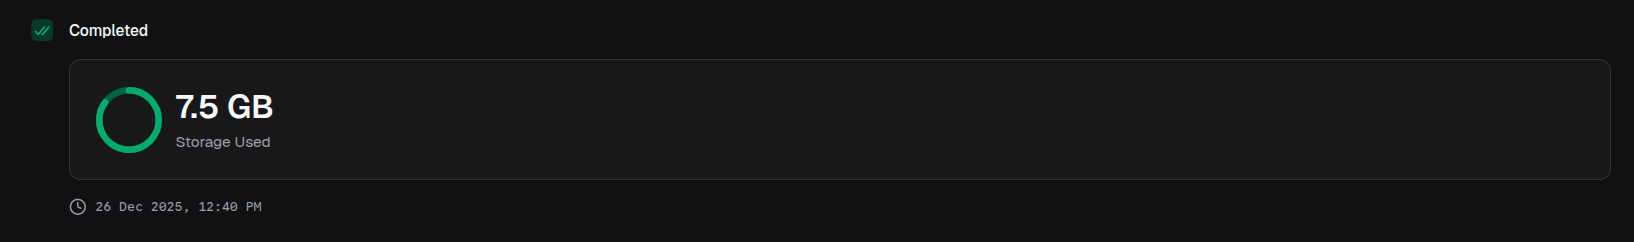
return block.kpiCard({
  name: 'Storage Used',
  value: '7.5 GB',
  chart: {
    type: 'chart',
    chartType: 'progress-bar',
    value: 75,
    max: 100,
    variant: 'default',
  },
})
With progress circle
return block.kpiCard({
  name: 'Goal Progress',
  value: '$85,000',
  change: 'of $100,000',
  changeType: 'neutral',
  chart: {
    type: 'chart',
    chartType: 'progress-circle',
    value: 85,
    max: 100,
  },
})
With tracker
![]()
return block.kpiCard({
  name: 'Uptime',
  value: '99.9%',
  chart: {
    type: 'chart',
    chartType: 'tracker',
    data: last30Days.map((day) => ({
      name: day.date,
      color: day.uptime > 99.5 ? 'emerald' : 'red',
    })),
  },
})
Dashboard with multiple KPIs
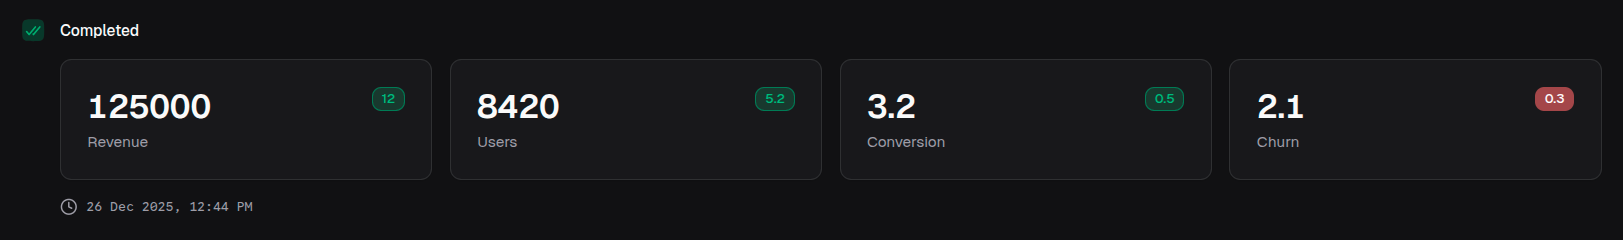
return block.layout({
  columns: 12,
  children: [
    {
      element: block.kpiCard({
        name: 'Revenue',
        value: 125000,
        valueFormat: { type: 'currency', currency: 'USD' },
        change: 12,
        changeType: 'positive',
      }),
      colSpan: 3,
    },
    {
      element: block.kpiCard({
        name: 'Users',
        value: 8420,
        change: 5.2,
        changeType: 'positive',
      }),
      colSpan: 3,
    },
    {
      element: block.kpiCard({
        name: 'Conversion',
        value: 3.2,
        valueFormat: { type: 'percentage', decimals: 1 },
        change: 0.5,
        changeType: 'positive',
      }),
      colSpan: 3,
    },
    {
      element: block.kpiCard({
        name: 'Churn',
        value: 2.1,
        valueFormat: { type: 'percentage', decimals: 1 },
        change: 0.3,
        changeType: 'negative',
      }),
      colSpan: 3,
    },
  ],
})